Interesting Shift in Oilfield Service Industry
By: John Sinders
Concerned About a Slowdown?
Try the International Markets. Over the last two years, much of the focus in the oil and gas industry has been on the tremendous growth in the U.S. land shale fields, which have been the most prolific producers, and thus largest consumers of oilfield products and services. Domestic Exploration and Production companies (E&Ps), and those international oil companies (IOCs) that work in the shale fields, have been responsible for the majority of oil service companies’ earnings, even as prices for those services fell sharply after the 2014 oil price decline. As these E&P companies began to change their strategies and move toward reining in capital expenditures and production growth in order to generate free cash the face of reduced E&P activity.
However, while substantially all attention was being paid to the shales, an interesting shift has been occurring in the industry. Activity in several international oil producing basins began to slowly but steadily increase, providing oil service companies with opportunities to grow and expand markets for their products and services
Oilfield Service Companies Finding Opportunities in International Markets
Recent commentary from oil service providers highlighted the shift towards international, showing a clear broad-based upward trend in both earnings and forecasts across multiple overseas geographic regions. This trend was evident in second quarter earnings reports, in which several oilfield service companies showed quarter/quarter international segment revenue increases of between approximately 7% and 18%, leading to projected earnings growth of 5% to 10% internationally over the next several quarters.
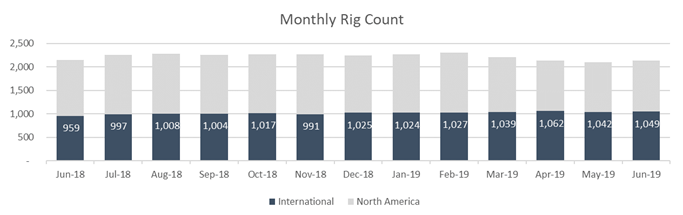
The upward momentum is underpinned by a steadily rising international rig count, which, as can be seen in the table below, increased by 9% between June 2018 and June 2019 and rose to 49% of rigs drilling worldwide compared to 45% in June 2018. During the same time period, the U.S. rig count fell 9% and U.S. rigs drilling fell to 51% of the worldwide rig count compared to 55% in June 2018.
Overview of International Market Opportunity
- International Landscape
While the end goal in exploring for oil and gas is the same worldwide, the process of producing and ultimately selling the product, as well as the operators who work in domestic or international areas, can vary enormously.
International activity is dominated by National Oil Companies (NOCs) and IOCs, while US activity, particularly on land, has traditionally been led by a variety of small to large U.S.-based E&P operators. International projects are generally larger, more complicated and thus longer cycle in nature than are those on the domestic side, so the planning and decision-making processes among the international players depend on very different projection methodologies.
- How Oil Price Volatility Impacted International Projects
Prior to mid-2014, when oil prices were in the $90 to $115 range, it was economically feasible for these large IOCs and National Oil Companies (NOCs) to sanction big, complex projects at profitable levels, as the breakeven cost for these projects generally fell into a range of around $50 to $60 a barrel for smaller exploration prospects, and $70 to $80 a barrel for larger ones. As oil prices dropped to $53 by year-end 2014 and continued to fall into the mid-$40 range over the next two years, many of these longer cycle, complex projects were either postponed indefinitely or canceled altogether.
The downturn was far more protracted than most oil companies expected, and the impact of far lower prices was a severe blow to many of these large operators’ balance sheets. That environment led to what turned out to be a three-year period in which large IOCs and NOCs were forced to focus on restructuring their own balance sheets, scale back plans for future exploration and focus on reworking plans and reducing oil service costs on already producing oil fields in order to turn some measure of profit on current production.
Beginning in 2017, oil prices began to stabilize in the $50 to $60 range, and the newly restructured and refocused companies were able to restart the planning process for new exploration projects which were becoming increasingly necessary for them to reverse field depletion that occurred during the recalibration years and set targets for future production.
- The Ripple Effect Through the Domestic Markets
During the same period, oil service companies were also forced to scale back—reducing workforces and attempting to respond to demands for services at far lower prices. International and domestic activity levels declined severely, and it wasn’t until mid-2017 that they began to see a pick-up in activity led by U.S. land E&P companies. As the U.S. shale boom picked up steam and production from these fields began to flow faster and at far higher levels than anticipated, oil service earnings became far more leveraged to domestic activity than to international work. Because the service providers were forced to implement large layoffs and capital efficiency plans, they learned to work faster, more efficiently and at lower cost, providing targeted goods and processes that could anticipate the new demands of higher, quicker producing shale fields. For oil service providers that had both domestic and international operations, U.S. earnings began to consistently outpace those from international work
Conclusion
Meanwhile, IOC and NOC customers began to turn to oil service providers for help in planning new exploration and development projects based on profitability at $30 to $40 a barrel oil rather than the $60 to $80 range enjoyed prior to 2014. Oil service companies responded with new technologies and processes developed during the shale boom to bring fresh ideas and more cost and operational efficiencies to these customers.
International Operators Leveraging U.S. Shale Playbook to Expand Globally
After rebalancing their portfolios and recalibrating their capital spending plans, a growth trend began to emerge in 2017 as international operators commenced approvals for new exploration and development plans. The number of Final Investment Decisions (FIDs) increased sharply in 2017, with a total of 20 FIDS approved. The number increased to 30 in 2018 and there are estimates that an additional 30+ FIDS may get approved in the back half of 2019. While it is true that there can be a long lead time between approval and the commencement of actual project drilling activity, the increase in the international rig count from 959 rigs in June 2018 to 1,049 in June 2019 clearly underscored a steady increase in activity, with large, long-cycle projects comprising a growing share of that activity. Those oil service companies that provide early cycle project work started to see higher international earnings early this year, and those involved in later phases of project cycles, are just beginning to see a ramp up in international earnings that are projected to continue to increase through the next several quarters.
While it has been easy to attach the fortunes of oil service companies to the U.S. land rig count cycle, it is not necessary to do so. The oil and gas industry has always been cyclical in nature, but it is important to recognize that there is not only one cycle, but many different ones that depend on a wide variety of geographic and economic factors. Many oil service companies are able to provide their products and services in many different drilling basins in the world and are able to recognize and capitalize on opportunities to grow and profit from providing their services wherever they occur. It can, therefore, be equally profitable for investors in the sector to broaden their perspective and recognize those opportunities as they present themselves.